Online evaluation measures an LLM application under real traffic. In an A/B test, independent units such as users or accounts are randomly assigned to control or treatment. The observed difference estimates the effect of a prompt, model, retrieval, or tool change.
This catches behavior a fixed offline set misses, including distribution shifts and long conversations. The estimate is credible only when assignment, exposure, metric definitions, and analysis refer to the same experiment. Experiment platform architecture describes the machinery that holds those contracts together.
Define the primary outcome and abort conditions before traffic starts. Longer responses are not a win when resolution falls. A resolution lift is still unshippable when safety incidents or p95 latency cross the guardrail.
What to Measure
| Metric type | Examples | Role |
|---|---|---|
| Task outcome | Resolution rate, escalation rate, completion | Primary product effect |
| User outcome | CSAT, re-contact rate, corrected-answer rate | Quality from user behavior |
| Safety | PII leak rate, policy violation rate | Guardrail and abort condition |
| Efficiency | Cost per resolved case, p95 latency | Operational guardrail or secondary metric |
| Engagement | Follow-up rate, session length | Diagnostic proxy, not success by itself |
A metric contract names its numerator and denominator, attribution window, exclusions, and aggregation unit. “Resolution rate” remains ambiguous until one user, conversation, or message is chosen as the observation.
Running a Safe A/B Test
Hypothesis: prompt v2 improves account-level resolution rate.

Assignment unit: account
Primary metric: resolved_accounts / exposed_accounts
Guardrails: pii_incident_rate, latency_p95
Minimum detectable effect: +2 percentage points
Power: 80%
Significance level: 5%
Runtime: long enough to reach sample size and cover weekly seasonality
Ramp: 1% → 10% → 50%, with guardrail aborts at every stage
The assignment unit determines the independent analysis unit. If treatment is assigned per account, ten conversations from that account remain correlated. They are not ten independent samples. Analyze account-level outcomes or use an estimator that models the clustering. Message-level randomization can also create carryover when one user sees both variants.
Choose the estimator from the metric and design:
- For a binary user-level outcome, estimate a difference in proportions and its confidence interval.
- For a continuous user-level outcome, Welch’s t-test is often a reasonable large-sample default. Inspect heavy tails and use a robust or bootstrap estimator when a few users dominate the mean.
- For ratio metrics such as cost per resolved case, preserve the joint numerator/denominator structure rather than treating per-event ratios as independent values.
- For clustered, repeated, or triggered observations, use unit-aware methods. Changing the test name does not repair a mismatched assignment and analysis unit.
Pre-register the minimum detectable effect, sample size, stopping rule, and segmentation plan. A p < 0.05 result can still be operationally irrelevant. Report the effect estimate and confidence interval, not only the threshold crossing.
Power and Uncertainty
An underpowered experiment often misses a real effect. It does not inherently create more false positives when the significance level and stopping rule are respected. The subtler problem appears among the few underpowered experiments that do reach significance: unusually large estimates are the ones most likely to cross the threshold. That selection exaggerates the apparent effect.
Repeatedly peeking and stopping on the first significant result does inflate false positives. Use the predeclared fixed horizon or a valid sequential design when continuous monitoring is required.
Segmentation
Define decision-driving segments before analysis. An average improvement can hide harm to one language, plan, geography, or device class. Post-hoc slices are useful for finding hypotheses, but many comparisons also produce false discoveries. Label them exploratory and confirm consequential findings in another test.
Monitoring versus Experimentation
| Aspect | Continuous monitoring | A/B test |
|---|---|---|
| Purpose | Detect degradation | Estimate the effect of a specific change |
| Traffic | Current production behavior | Randomized control and treatment |
| Duration | Ongoing | Planned sample and stopping rule |
| Decision | Alert on a threshold | Ship, reject, or gather more evidence |
Monitoring catches drift and outages, including provider-side changes. Randomization estimates the causal effect of an intentional change. One does not substitute for the other.
Experiment Platform Architecture
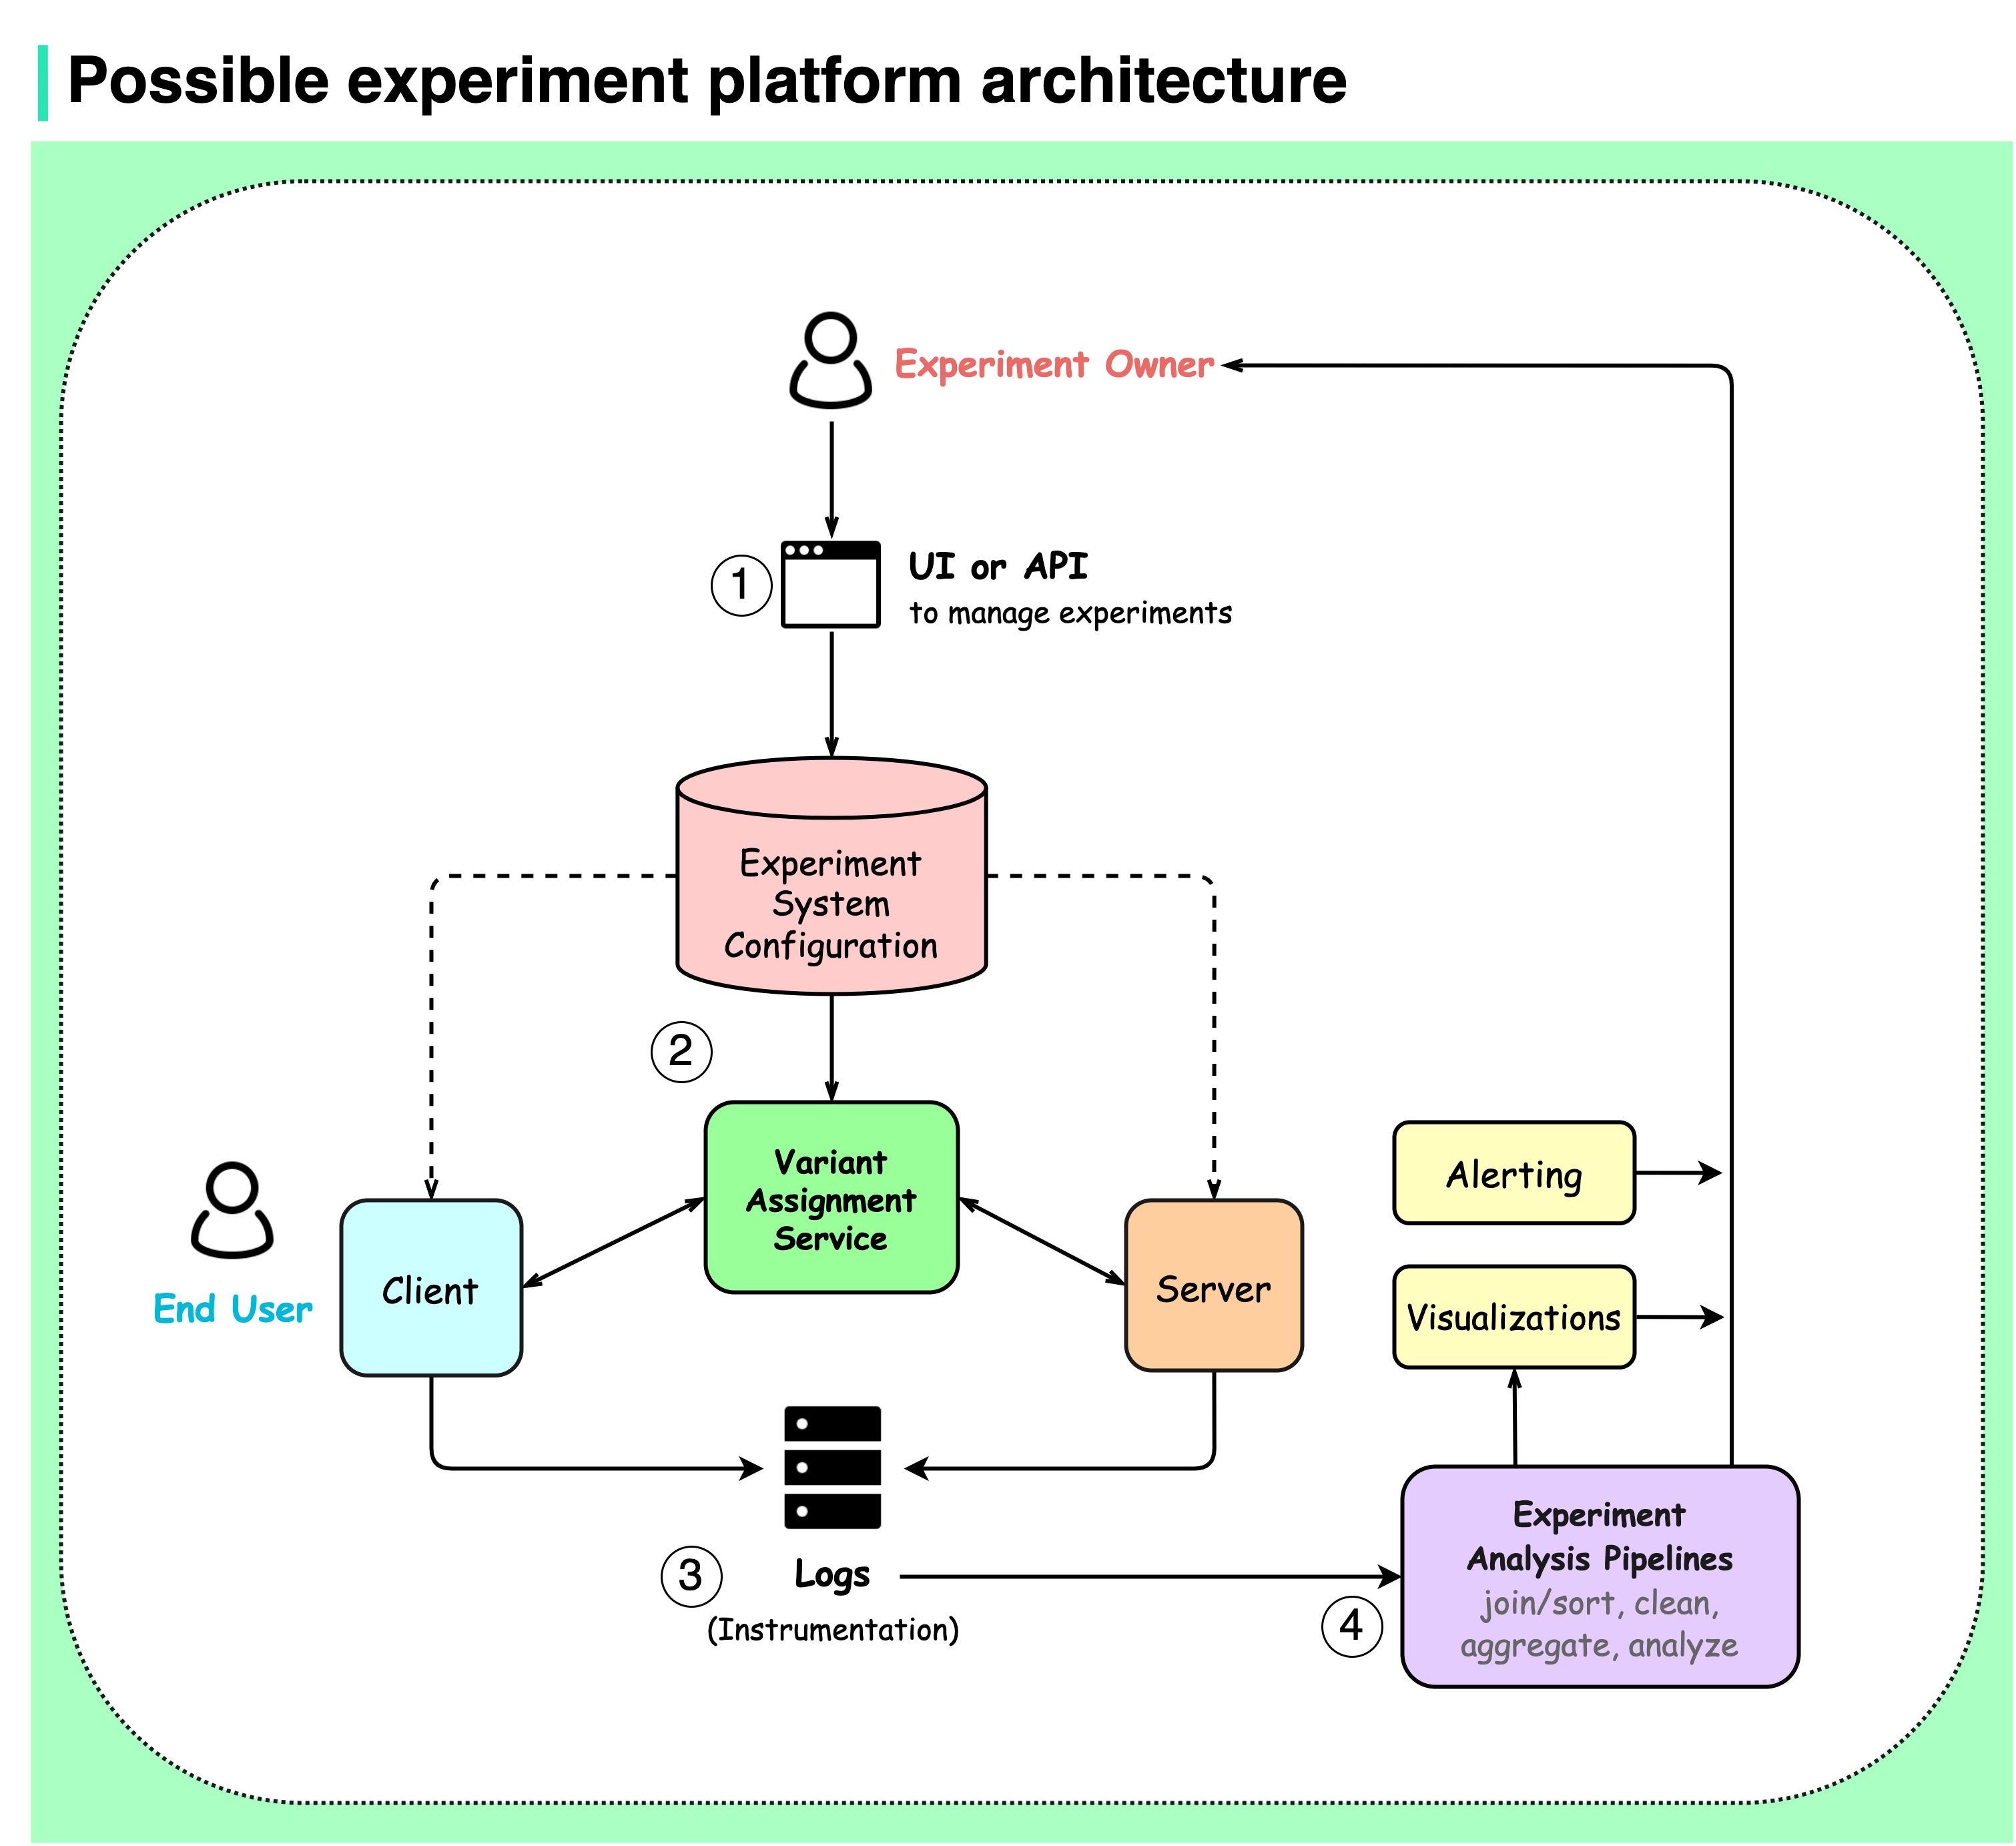
An experiment platform makes a randomized decision reproducible. Its control plane binds the hypothesis and eligibility rules to assignment, exposure, metrics, and analysis under one immutable experiment version. Without that record, a dashboard can compare unexposed users or recompute the primary metric under rules introduced after traffic ran.
Configuration Lifecycle
An experiment definition records the hypothesis, owner, eligibility rule, variants, assignment unit, metrics, ramp, and stop policy. Once traffic starts, changing the definition creates a new version. Exposures collected under different rules must remain distinguishable.
draft → approved → running → stopped → analyzed → archivedA kill switch can stop new assignments immediately, but it must not delete the historical definition or exposure log needed for audit and analysis.
Deterministic Assignment
Hashing a stable identifier gives the same unit the same variant on every service instance:
bucket = Hash(experimentId, version, accountId, salt) mod 10_000

0..4_999     → control
5_000..9_999 → treatment
The assignment unit is a product decision. An account is appropriate when its users influence one another. A device works only when stable identity is unavailable and cross-device inconsistency is acceptable. Salt and version keep a new experiment from accidentally reusing an old allocation.
Exposure, Not Eligibility
Assignment records intent. It does not prove the treatment affected a response. Record exposure where the selected variant can first change behavior, with the experiment version, unit ID, variant, timestamp, and attribution context. Join outcomes through that event, but preserve randomization: the trigger rule must be evaluated before variant-specific behavior. Conditioning on an exposure caused by the treatment can bias the estimate.
Log exposure idempotently or deduplicate it in analysis. Duplicate events must not turn one account into several independent observations.
Metric and Analysis Contracts
Analysis must use the metric definition approved at launch. Data quality comes first. A material 62/38 allocation in a planned 50/50 split points to a defect in eligibility, hashing, logging, or filtering. Stop interpreting the treatment effect until that sample-ratio mismatch is explained. Missing exposure fields, duplicate units, delayed outcomes, and stale guardrails need the same treatment.
The result should include an effect estimate, confidence interval, sample counts at the assignment unit, and the predefined decision criteria. A dashboard visualizes that record. It should not invent a new analysis after launch.
Centralization adds schema governance and launch ceremony. It pays off when several teams run experiments or decisions affect safety, revenue, or policy. A small product can start with versioned configuration, stable hashing, an exposure table, and a reviewed analysis notebook. Those contracts still need one owner.